10 Best Statistical Analysis Software
Statistical analysis software solutions are tools for collecting and analyzing data to provide insight into patterns and trends. They rely on mathematical calculations and statistics theorems to enable data science techniques like regression and time-series analysis.
Statistical software has become a very important tool for companies to perform their data analysis. The software uses Artificial Intelligence and Machine Learning to perform complex calculations, identify trends and patterns, and create charts, graphs, and tables accurately within minutes. Advantages of using qualitative data analysis software include being freed from manual and clerical tasks, saving time, being able to deal with large amounts of qualitative data, having increased flexibility, and having improved validity and auditability of qualitative research.
Top 10 Software
1. IBM SPSS software

IBM SPSS Statistics is a powerful statistical software platform. It offers a user-friendly interface and a robust set of features that lets your organization quickly extract actionable insights from your data. Advanced statistical procedures help ensure high accuracy and quality decision making.
2. Minitab

Minitab is a software product that helps you to analyze the data. This is designed essentially for the six sigma professionals. It provides a simple, effective way to input the statistical data, manipulate that data, identify trends and patterns, and then extrapolate answers to the current issues. This is most widely used software for the business of all sizes – small, medium and large. Minitab provides a quick, effective solution for the level of analysis required in most of the Six Sigma projects.
3. Originlab

Origin is a proprietary computer program for interactive scientific graphing and data analysis. It is produced by OriginLab Corporation, and runs on Microsoft Windows. OriginLab is a leading developer of scientific graphing and analysis software. OriginLab products, Origin and OriginPro, provide a comprehensive solution for scientists and engineers who need to analyze, graph, and professionally present data.
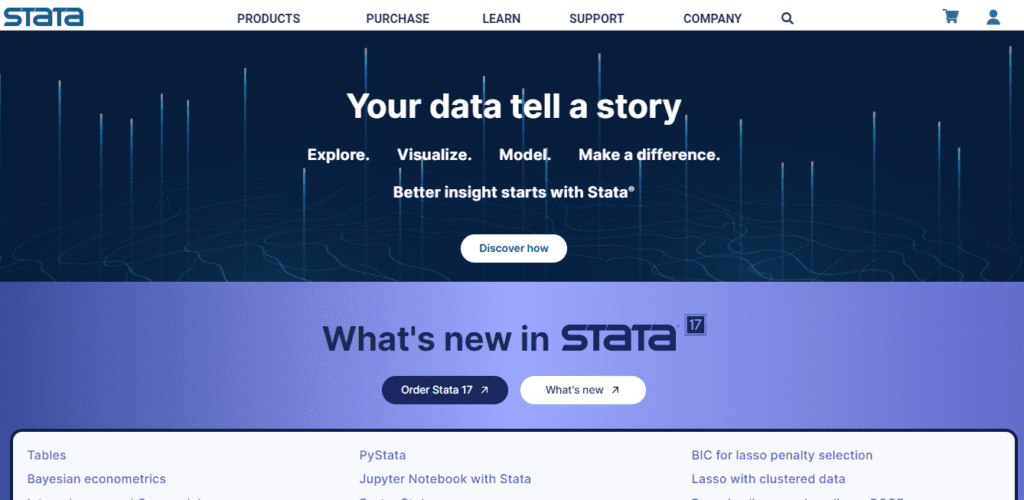
4. Stata

Stata is a general-purpose statistical software package developed by StataCorp for data manipulation, visualization, statistics, and automated reporting. It is used by researchers in many fields, including biomedicine, epidemiology, sociology and science.
5. Sas

SAS is a statistical software suite developed by SAS Institute for data management, advanced analytics, multivariate analysis, business intelligence, criminal investigation, and predictive analytics. SAS was developed at North Carolina State University from 1966 until 1976, when SAS Institute was incorporated. SAS analytics solutions transform data into intelligence, inspiring customers around the world to make bold new discoveries that drive progress.
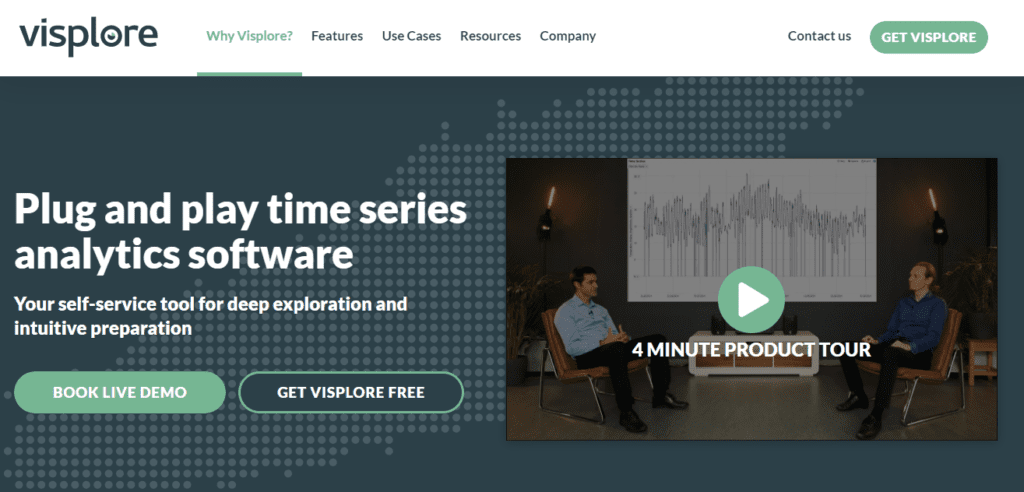
6. Visplore

Visplore is a graphical software for exploring large multivariate data, like time series from machines or sensors. Ready-to-use analysis tools save massive amounts of time for data preparation and support also non-programmers in making valuable discoveries.
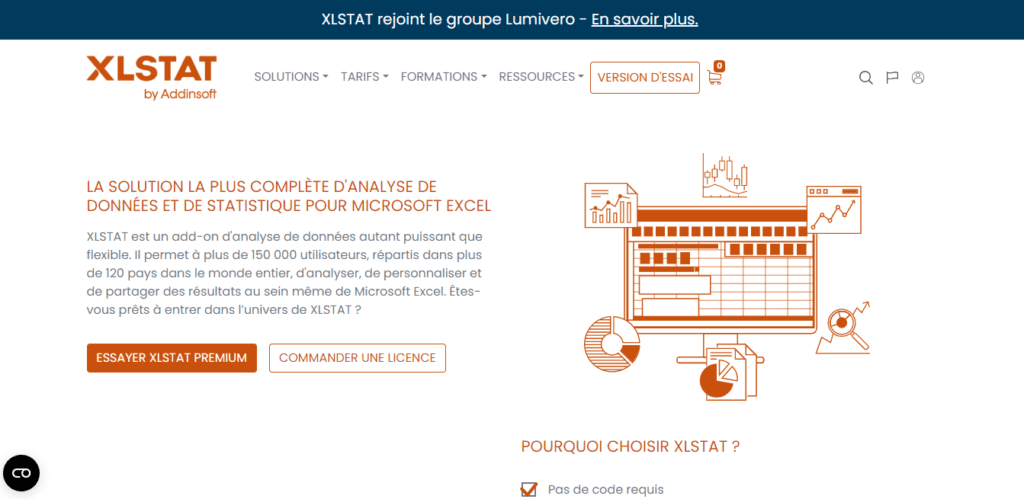
7. xlstat

XLSTAT is a powerful yet flexible Excel data analysis add-on that allows 150,000+ users in over 120 countries across the world to analyze, customize, and share results within Microsoft Excel.
8. Qlik

Qlik provides a business analytics platform. The software company was founded in 1993 in Lund, Sweden and is now based in King of Prussia, Pennsylvania, United States. The company’s main products are Qlik Replicate and Qlik Sense, both software for business intelligence and data integration.
9. Looker

Looker is a powerful business intelligence (BI) tool that can help a business develop insightful visualizations. It offers a user-friendly workflow, is completely browser-based (eliminating the need for desktop software) and facilitates dashboard collaboration.
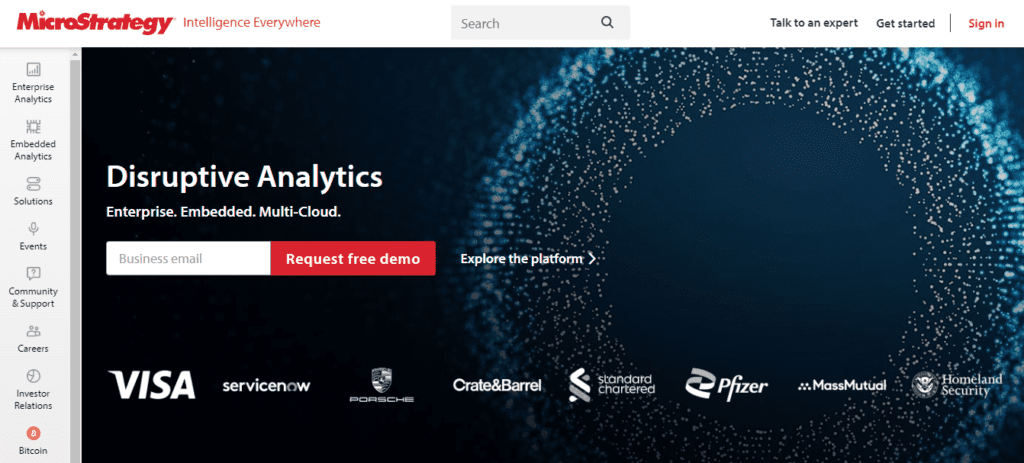
10. MicroStrategy

MicroStrategy is an enterprise business intelligence (BI) application software vendor. Its flagship platform contains multiple features designed to help enterprises make data-driven decisions and optimize business processes. MicroStrategy provides a single, cohesive offering that empowers both IT professionals and business users to fully harness the power of their data. MicroStrategy is the only analytics platform on the market that combines enterprise-grade performance, scalability, and security with easy-to-use interfaces and workflows.
Conclusion
Statistical analysis tools enable statisticians or business professionals to find correlation, regression, analysis of variance, and more with ease. With these insights in hand, businesses can make sense of their data and make informed decisions based on it. These tools help identify duplicates and unusual cases that may arise during data cleaning and data curation and get detailed data analysis reports. and in today’s article we shared with you 10 of the best statistical analysis softwares in the market , we hope that it will be helpful for you and your business .
See you in the next article .


