

10 Best Data Analytics Tools & Software
Big data analytics is important as it lets organizations use data from multiple sources and in multiple formats to identify opportunities as well as risks. This lets the organisations save on costs, understand better their customers and get market trends.

Read more about how software can be used by organizations to reap the benefits of big data, and discover the best tools to achieve that.
Top 10 Software
1. Tableau
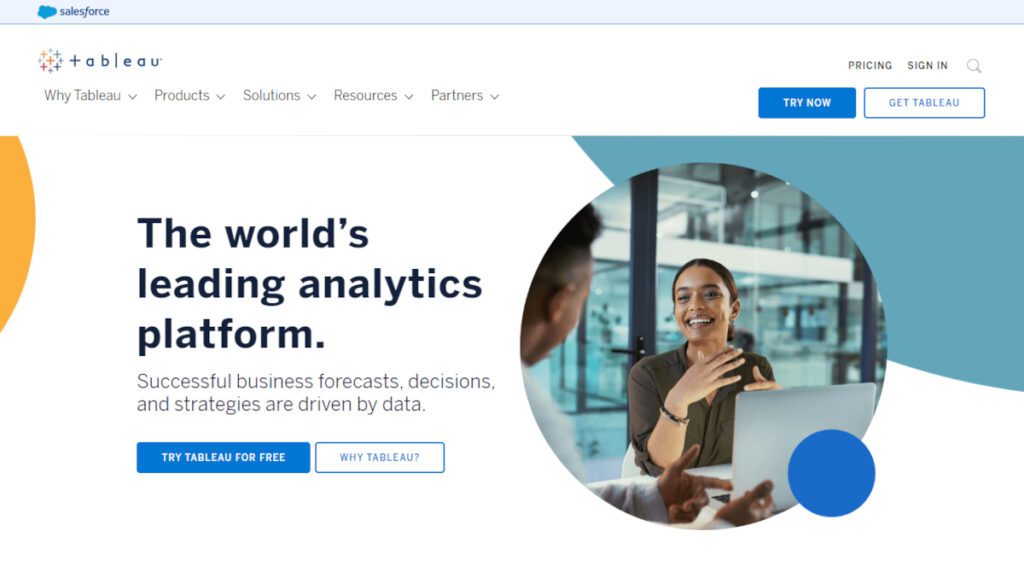
With Tableau, you can deliver visual analytics to your organization in whichever way makes the most sense to you. Tableau is an end-to-end data analytics platform that allows you to prep, analyze, collaborate, and share your big data insights. Tableau excels in self-service visual analysis, allowing people to ask new questions of governed big data and easily share those insights across the organization.
Tableau provides a flexible front-end for data exploration with the necessary analytical depth for the data scientist. By leveraging sophisticated calculations, R and Python integration, rapid cohort analysis, and predictive capabilities, data scientists can conduct complex, quantitative analyses in Tableau, and share visual results to facilitate better understanding and collaboration with data.
Integrate with R and Python directly in Tableau so you can leverage preexisting models or script in-app.
From suggesting relevant content to supporting drag-and-drop statistical analyses, Tableau makes the most of machine learning and advanced analytics to put the power of data discovery in everyone’s hands. Tableau brings you the wisdom of all your organization’s experts by taking advantage of collective insights. How? By providing features like smart table and join recommendations, which suggest data prep functions based on what other Tableau users have done.
With Tableau, you can deliver visual analytics to your organization in whichever way makes the most sense to you. Use Tableau Mobile for on-the-go data access and analysis on any device, or explore and interact with vizzes directly in the browser. You can even embed your analytics into other applications to give them more visibility. Want to allow your customers to benefit from powerful analytics? Integrate Tableau into your own product, and make your solution shine. From customer support to product training and roadmap collaboration.
Your analytics should be fast to create, and faster to market. With Embedded Analytics from Tableau, you’ll make the most of your investments to deliver the right solution to your customers. From concept to deployment.
Tableau Desktop delivers everything you need to access, visualize, and analyze your data. With an intuitive drag and drop interface, you can uncover the hidden insights you need to make impactful business decisions faster, even when you are offline. All while leveraging trusted and governed data in a secure self-service environment.
2. Qlik
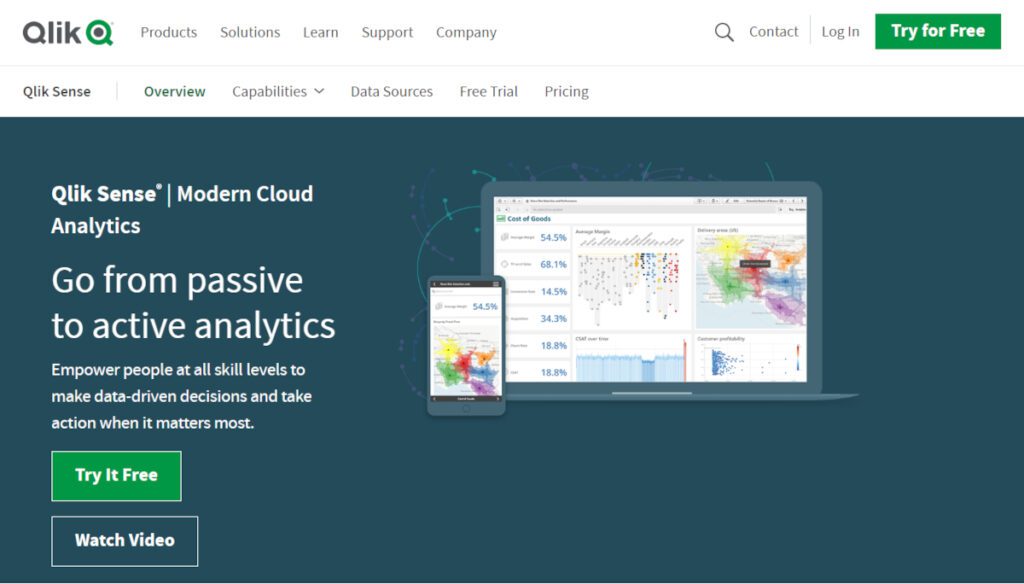
Qlik closes the gaps between data, insights and action with the only cloud platform built for Active Intelligence. Make your data and analytics real-time, AI-driven, collaborative and actionable. Empower people at all skill levels to make data-driven decisions and take action when it matters most.
Deeper interactivity. Broader context. Lightning fast. No one else compares.
Qlik’s one-of-a-kind Associative technology brings unmatched power to the core of the industry-leading analytics experience. Empower all your users to explore freely at the speed of thought with hyperfast calculations, always in context, at scale. Yeah, it’s a big deal. And it’s why Qlik Sense takes you way beyond the limits of query-based analytics and dashboards competitors offer.
Deliver on even the most complex use cases, all within a single cloud platform:
– Self-service Visualization
Easily combine, load, visualize, and explore your data, no matter how large (or small). Ask any question and follow your curiosity. Search, select, drill down, or zoom out to find your answer or instantly shift focus if something sparks your interest. Every chart, table, and object is interactive and instantly updates to the current context with each action. A broad library of world-class, smart visualizations convey meaning, reveal the shape of data, and help pinpoint outliers. And get faster time to insight with assistance from Insight Advisor for auto-generated analysis, chart recommendations, and data combination.
– Interactive Dashboards
Create, share and distribute powerful dashboards to support executives, business leaders, and anyone else that needs to stay on the pulse of the business. Every element is interactive, taking users beyond the static dashboards of the past. When something stands out, easily dive in to explore what’s happening. Make selections anywhere and search globally to refine context and quickly hone in on the information needed to take action. With Qlik Sense, dashboards become a powerful jumping-off point to make better, data-driven decisions.
– Search & Conversational
Search & Conversational analytics provide a simple and powerful way to interact with data and generate insights using natural language. With search-based visual discovery, Insight Advisor auto-generates the most relevant and impactful analyses and insights for the user, based on natural language processing (NLP). And with conversational analytics, you get a fully interactive natural language experience in Qlik Sense. Insight Advisor uses natural language processing and generation (NLP & NLG) to understand user intent and respond with answers and added insights, across all your Qlik Sense apps.
– Alerting & Action
Immediately react to changes in your data with alerting and automation. Provide sophisticated, data-driven alerts that help users proactively monitor their business and take timely action based on insight. Unlike other products, this alerting technology is fully data-driven, not based on individual visualizations, so you can monitor all your data without limitations. And go beyond alerting with event-driven actions which automate routine tasks and enable your key tools to work with your analytics. Use Application Automation, a visual low-code environment to turn insights into actions wherever they need to occur.
– Reporting
– Mobility
– Custom & Embedded
– Advanced Analytics
– And more.
3. Microsoft
Microsoft Power BI is a unified, scalable platform for self-service and enterprise business intelligence (BI). Connect to and visualize any data, and seamlessly infuse the visuals into the apps you use every day.
Meet both your self-service and enterprise data analytics needs on a single platform. Access powerful semantic models, an application lifecycle management (ALM) toolkit, an open connectivity framework, and fixed-layout, pixel-perfect paginated reports.
Take advantage of the latest advances in Microsoft AI to help non-data scientists prepare data, build machine learning models, and find insights quickly from both structured and unstructured data, including text and images.
Anyone who’s familiar with Microsoft 365 can easily connect Excel queries, data models, and reports to Power BI Dashboards helping to quickly gather, analyze, publish, and share Excel business data in new ways.
Go from data to insights and insights to action with Microsoft Power Platform combining Power BI with Power Apps and Power Automate to easily build business applications and automate workflows.
Bridge the gap between data and decision making:
– Create amazing data experiences
Easily connect to, model, and visualize your data, creating memorable reports personalized with your KPIs and brand. Get fast, AI-powered answers to your business questions even when asking with conversational language.
– Gain insight from your largest BI deployments
Make the most of your big data investments by connecting to all your data sources with the scale to analyze, share, and promote insights across your organization while maintaining data accuracy, consistency, and security.
– Make decisions with confidence
Work together easily on the same data, collaborate on reports, and share insights across popular Microsoft Office applications such as Microsoft Teams and Excel. Empower everyone in your organization to quickly make data-driven decisions that drive strategic actions.
Power BI for self-service and enterprise business intelligence:
– Begin creating
Get everything you need to create and save unlimited interactive reports—free—with Power BI Desktop.
– Share and collaborate
Use Power BI in the cloud for easy report sharing and collaboration through professional and premium versions.
– Work on the go
Get Power BI Mobile, a free app for Android, iOS, and Windows, to view and collaborate on reports and visualizations anywhere.
4. SAS
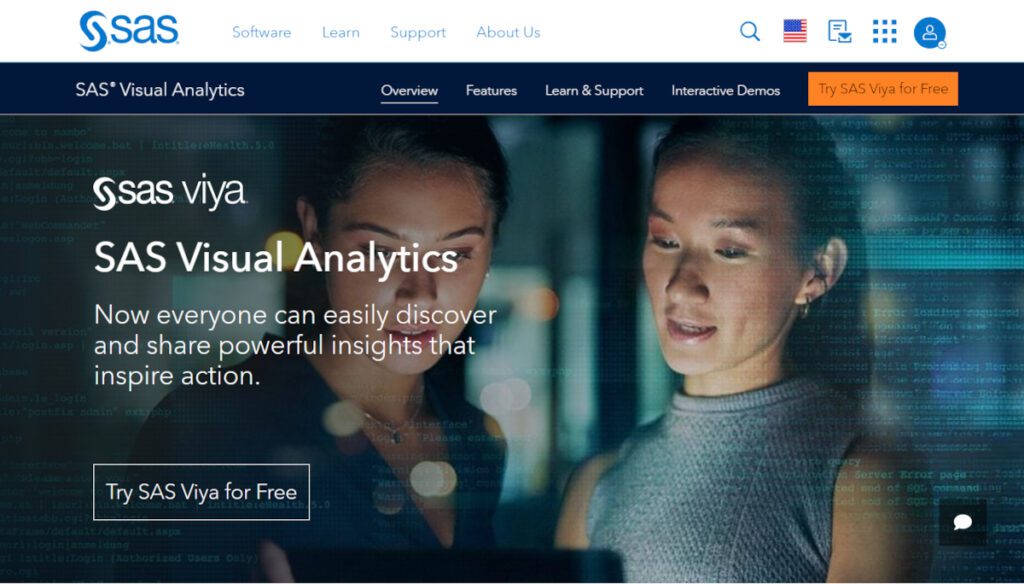
SAS Visual Analytics provides a modern, integrated environment for governed discovery
and exploration. Users, including those without advanced analytical skills, can examine and understand patterns, trends and relationships in data. It’s easy to create and share reports and dashboards that monitor business performance. Easy-to-use analytics and visualizations help everyone get insights from data to better solve complex business problems.
Users of all skill levels can visually explore data, use automated analysis and create visualizations while tapping into powerful in-memory technologies for faster computations and discoveries. This self-service solution scales to an enterprisewide level, putting data and analytics in the hands of more people. At the same time, governance capabilities help IT promote consistency and reuse.
It’s designed for anyone in an organization who wants to create, share and collaborate on insights from data. That includes decision makers, business analysts, report creators and citizen data scientists. It also provides IT with an easy way to govern and manage data integrity and security.
A single application for reporting, data exploration and analytics. See the big picture and underlying connections. Quickly spot important relationships in your data using suggestions and clearly identified related measures. Use machine learning and natural language explanations to find, visualize and narrate stories and insights that are easy to understand and explain. Find out why something happened, examine all options and uncover opportunities hidden deep in your data. Automatically highlight key relationships, outliers, clusters and more to reveal vital insights that inspire action.
SAS Visual Analytics (SAS Viya) features list:
– Import data from a variety of sources: databases, Hadoop, Excel spreadsheets, social media, etc.
– Use standard data quality functions like change case; convert, rename, remove and split columns; and create calculated columns and transformations using custom code.
– Interactive data discovery enables business users and analysts to easily identify relationships, trends, outliers, etc.
– Precise and responsive layout capabilities give you flexible layout and design options. You can stack or group items, and more.
– Report Review analyzes your report and presents suggestions for improvements that can be made to the report itself or to the data used by the report. Report review also checks for accessibility issues.
– Autocharting automatically chooses the graph best suited to display selected data.
– Automatically builds an interactive analytical story based on all your data, ready to be published.
– SAS Conversation Designer, which is included with SAS Visual Analytics, empowers users to create and deploy custom, natural language chatbots.
– Reuse and share report modifications, such as filters, calculations, hierarchies and report element formatting.
– Save a page as a template for use in other reports and to share with other users.
– Collaborate across mobile devices and the web by adding comments to a report. And more.
5. Looker
Looker Looker is a business intelligence software and big data analytics platform that helps you explore, analyze and share real-time business analytics easily.
Let your data do the talking, reveal the true power of your data and bring clarity. Looker & Google Cloud’s data analytics platform can provide options to help you deliver value through the use of strong, fresh insights.
– Modern BI & analytics
Serve up real-time dashboards for in-depth, consistent analysis. Access to consistent data can enable teams to collect fresh results for reporting.
– Integrated insights
Enhance the tools you’re already using by infusing new, relevant data. Looker can unify and empower your teams to make effective, data-informed decisions.
– Data-driven workflows
Invigorate your workflows with fresh, reliable data. Looker can give teams unified access to the answers they need to help drive successful outcomes.
– Custom applications
Create custom apps that can deliver data experiences as unique as your business. Looker’s embedded analytics solutions, from retail to healthcare, can give your customers the data they need to get the job done.
Multicloud and the power of choice, Looker can support multiple data sources and deployment methods, which can provide options that would not compromise on transparency, security, or privacy.
– Choose your database
Looker can connect with BigQuery, Redshift, Snowflake, and 50+ supported SQL dialects, so you can link to multiple databases, avoid database lock-in, and maintain multicloud data environments.
– Choose your cloud
Freedom in your technology stack is important. Looker supports hosting on public clouds like Google Cloud Platform and AWS, and in multicloud and hybrid environments.
– Choose your workflow
Give your teams the tools they need to succeed. With Looker Blocks, embedded visualizations, and more, Looker can help them with analytics and insights that can drive results.
6. Sisense
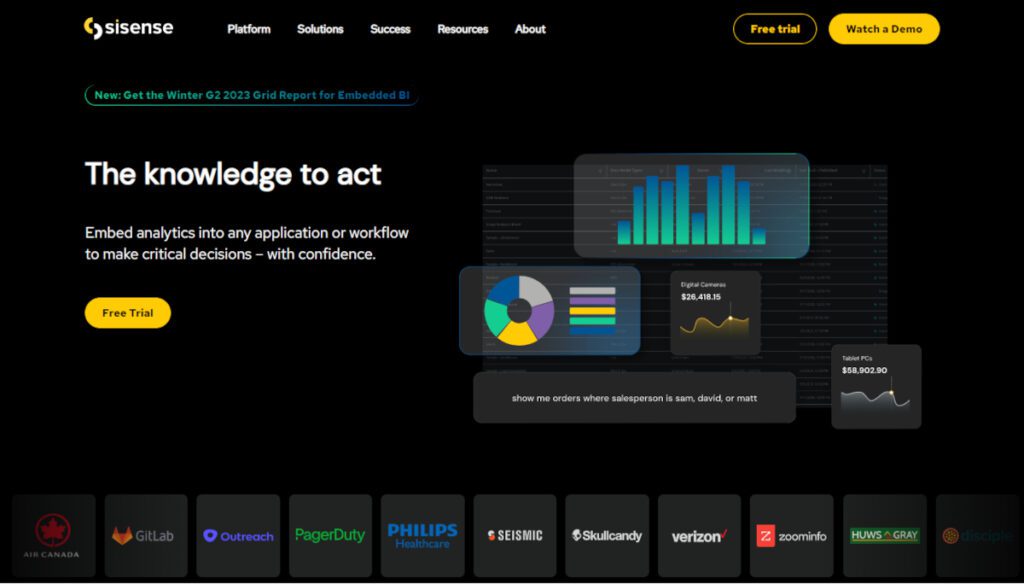
Sisense goes beyond traditional business intelligence by providing organizations with the ability to infuse analytics everywhere, embedded in both customer and employee applications and workflows.
Level up strategic decisions at the right place and the right time. Move beyond standard business intelligence software and empower everyone across your organization by infusing intelligence into workflows and processes that accelerate business growth. With Sisense Fusion Analytics, you have one analytics platform to answer all business questions, no matter the complexity.
It offers one platform, with three powerful solutions. To connect, analyze, explore, and collaborate with or without code to uncover powerful insights. With APIs at every endpoint, leverage full customization from the look and feel of the front end to deep control around security and monitoring of the back end.
Flexbility and cloud agnostic deployment and integration capabilities with AWS, Snowflake, Google, and Microsoft. Customized experiences by leveraging low code to full code to create custom workflows. Intelligence everywhere with custom self-service experiences and deep embedding.
– Connect data from anywhere
Data scale and complexity shouldn’t be a concern as your solution grows. Connect cloud, in-application and on-premises data for an AI-led 360-degree view.
– Analyze and explore data, code or no code
Optimize analytic talent and empower everyone to make intelligence-driven decisions. Code-first, low code, and no code tools enable you to transform, investigate and visualize large volumes of complex data. Richer data models serve granular details to filter and drill down into dashboards – no technical expertise required.
– Augment with machine learning
Use built-in code-first statistical and predictive analysis libraries and ML technologies to uncover future opportunities and outcomes. Access forward-looking insights by simply typing a question, no tech expertise required. Quickly understand analysis with natural language narratives to ensure everyone understands even the most complex analysis.
– Infuse intelligence everywhere
Access and deliver data and analytic insights where your business spends most of their time in everyday work, or business applications. Take the guesswork out of data and dashboards and improve employee productivity by utilizing the extensibility of Sisense Infusion Apps.
7. Domo
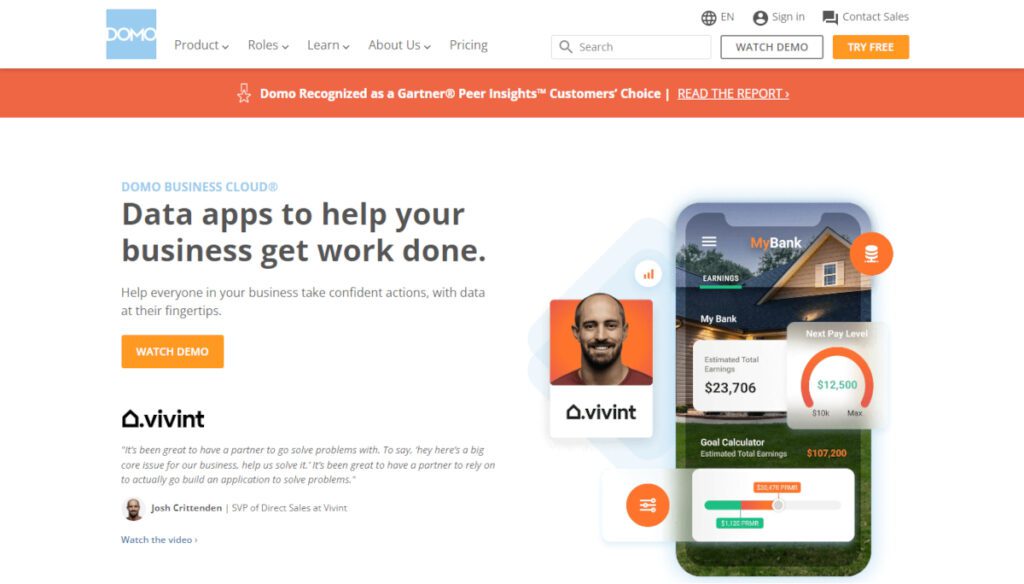
Domo is where data gets put to work within your business. Combine all your data, BI, and workflows into apps that change how work gets done. Domo can help you harness the power of your data in apps to drive action from your insights. The Domo Business Cloud is where work gets done proactively, faster, and smarter.
Whether you use Domo’s pre-built apps, create your own with low-code tooling, or let Domo help you, you can put data in the hands of those who need it, within their normal workflows, customized just for them.
– Make data exploration easier.
Transform raw data into visualizations that make it easier to interpret and quickly find answers to business questions.
– Share insights easily.
Interactive dashboards can be easily shared and explored by multiple people. Responsive design means visualizations automatically adapt to the viewer’s device.
– Go from reactive to proactive.
Automatically alert users when their relevant data changes, or thresholds are reached.
– Make data accessible to everyone.
Empower your people with access to self-service BI & analytics, incorporating data into every business process.
– Bring transparency to your data.
Build a single source of truth around your data, getting your teams on the same page.
– Drive faster action.
With real-time access to data, manage by exception and leverage insights to make confident decisions with impact.
Enable data storytelling, transform raw data into easy-to-understand visualizations to make data-driven decisions.
Incorporate AI and ML into your business intelligence workflows, manage by exception with automated alerts that signal need for action, even alerting people right on their phones.
Streamline external reporting, allow customers and partners to automate tailored reporting, getting insights faster and making your ecosystem more agile and responsive.
Provide external self-service analytics, let customers and partners explore data or use it in their own applications to uncover ways to improve services, value and margins.
Simplify and automate routine work. Embed purpose-built apps, facilitating important interactions with customers and partners inside the embedded environment.
8. SAP
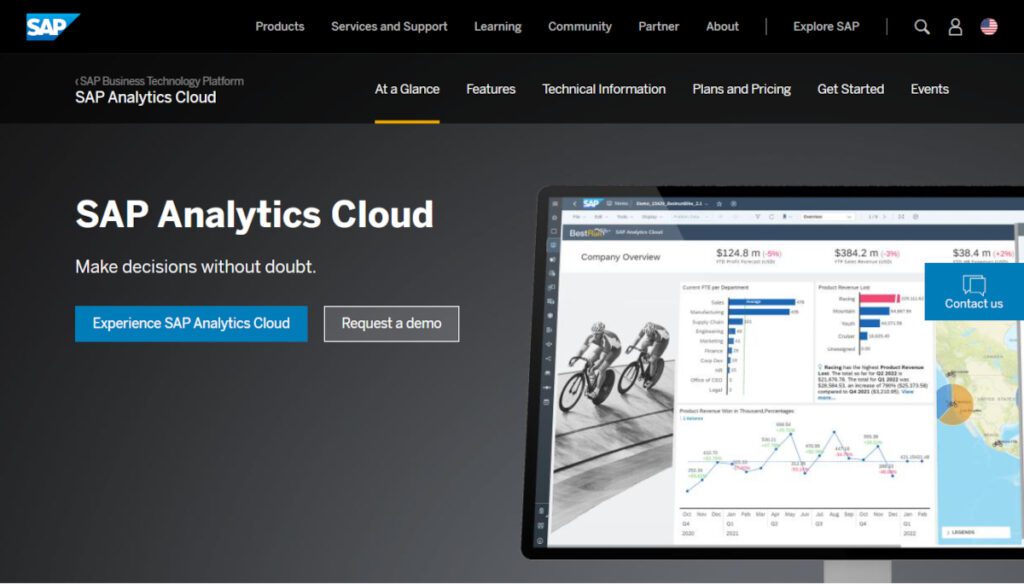
SAP Analytics Cloud brings together analytics and planning in a single solution in the cloud, with unique integration to SAP applications and smooth access to heterogeneous data sources. As the analytics and planning solution within SAP Business Technology Platform, SAP Analytics Cloud supports trusted insights and integrated planning processes enterprise-wide to help you make decisions without doubt.
Cloud analytics is the use of remote public or private computing resources – known as the cloud – to analyze data on demand. Cloud computing analytics helps streamline the process of gathering, integrating, analyzing, and presenting insights to enhance business decision-making.
There are a few reasons why SAP Analytics Cloud is different from other cloud analytics solutions:
– SAP Analytics Cloud brings together analytics and planning in a single solution in the cloud. You can instantly move from insight to action, simulate any scenario for better business outcomes, and generate plans from predictions automatically to drive agile decisions.
– As the analytics and planning layer of SAP Business Technology Platform, SAP Analytics Cloud supports analytics and planning enterprise-wide with smooth integration into SAP applications and sources. With a portfolio of data and analytics solutions, you can utilize the full context of SAP data and bring analytics closer to the point of decision with embedded analytics in your SAP cloud applications for lines of business.
– SAP Analytics Cloud comes with over 100 prebuilt best-practice SAP business content packages across lines of business and industries to accelerate analytics and planning projects.
– SAP Analytics Cloud can enable you to create bleeding-edge analytics with a complete solution. It automates insights with machine learning and allows you to compose specialized analytics apps faster and deliver high-performance analytics at scale.
Drive agile decisions with integrated planning and analysis:
– Move instantly from insight to action in one user experience.
– Simulate any scenario and automatically generate plans from predictions.
Derive unique insights from your most valuable data:
– Utilize the full context of SAP data and bring analytics closer to the point of decision.
– Accelerate deployments with prepackaged best practices for your function or industry.
Create bleeding-edge analytics with a complete solution:
– Automate data-driven insights with the power of machine learning.
– Compose specialized analytics apps quickly to address unique business requirements.
9. ThoughtSpot
ThoughtSpot is the Modern Analytics Cloud company. The Live Analytics services delivers personalized, actionable insights at the point of impact for every user, at every level.
ThoughtSpot’s dynamic search architecture sits directly on top of your cloud data platform so you can interact with all of your live cloud data at the most granular level.
ThoughtSpot empowers everyone to create, consume, and operationalize data-driven insights. The consumer-grade search and AI technology delivers true self-service analytics that anyone can use, while the developer-friendly platform ThoughtSpot Everywhere makes it easy to build interactive data apps that integrate with your existing cloud ecosystem.
Answer your own data questions instantly. As a business leader, you would get from this platform:
– Search the answer to any business question
No SQL? No problem. ThoughtSpot’s intuitive, Google-like search interface makes it easy to interact with cloud data from Snowflake, Google Big Query, Redshift, Databricks and more so you can get to your “why” faster.
– Create and share compelling data stories
Visualize your most important business metrics in real-time with interactive Liveboards that allow you to drill down, filter, add measures, and present on the fly. Your legacy BI tool could never.
– Get automated business monitoring and alerting
Stay on top of your most important business KPIs and learn why changes happen so you can take action in the moment.
Deliver safe, reliable, self-service analytics. As a data analyst, you would get from this platform:
– Connect to your cloud data platform in minutes
ThoughtSpot connects directly to your cloud data so you can start creating insights from day one. No data movement or caching required.
– Flexibly model your data, your way
Whether you prefer dbt, custom SQL views, or the lightweight worksheets, you can create a fully scriptable, centrally governed data model in minutes from the Data Workspace. It’s an analytics engineer’s dream come true.
– Drive analyst productivity through the roof with AI
Automatically spot anomalies, correlations, and trends in your data with SpotIQ’s AI-driven algorithm that gets smarter and more personalized after every use. When key metrics change, automatically alert users in apps like Slack, Microsoft Teams, and Gmail.
Build stickier analytics experiences. As a product builder, you would get from this platform:
– Embed analytics with just a few lines of code
Embed engaging Live Analytics experiences into any app, portal, or product with ThoughtSpot Everywhere’s developer-friendly platform.
– Analytics as code
Build using modern, open languages to reduce maintenance, and improve developer satisfaction and retention.
10. KNIME
KNIME Analytics Platform is an open source software that allows users to access, blend, analyze, and visualize data, without any coding. Its low-code, no-code interface offers an easy introduction for beginners, and an advanced data science set of tools for experienced users. Allowing anyone to build and upskill on data science.
KNIME builds software to create and productionize data science using one easy and intuitive environment, enabling every stakeholder in the data science process to focus on what they do best.
KNIME Analytics Platform is an open source software with an intuitive, visual interface that lets you build analyses of any complexity level, from automating spreadsheets to ETL to machine learning. Users can access, blend, analyze, and visualize data, without any coding, or integrate their favorite tools and libraries as needed.
Build Analytical Workflows Using an Intuitive UI, one single open source data analytics tool:
– No-Code/Low-Code Interface
Thousands of nodes designed to perform discrete actions on data. Create workflows by joining nodes together via an intuitive, drag-and-drop interface – no need for coding.
– Complete Range of Analytic Techniques
From automating spreadsheets, to ETL, to predictive modeling and machine learning — the software addresses data science needs of any level of complexity. Script in Python, R and more, to further extend the capability.
– Community-Driven Innovation
KNIME’s open source approach keeps users on the bleeding edge of data science, with integrations to all popular machine learning libraries, and 300+ connectors to data sources.
– Get Started Quickly
Download KNIME Analytics Platform & check out the KNIME Community Hub and the hundreds of publicly available workflows from users across disciplines and expert levels.
Blend Data from Any Source, blend different data types as strings, integers, images, text, networks, sound, molecules, and more. Connect to all major databases and data warehouses such as SQL Server, Postgres, MySQL, Snowflake, Redshift, BigQuery, and more. Blend large data volumes: import and export HDFS data and perform SQL analytics within Hive and Impala, or create and run Apache Spark applications within KNIME.
Conclusion
In this article, we’ve learned about the best data analyics platforms, what features they offer and how they can help you with data analytics. What these platforms share is that they have the same goal in addition to an intuitive user interface, using low code to no code to produce data analyses.


