
10 Best Online Graphs & Charts Maker
Charts enable you to visually compare multiple sets of data. Charts can help people better understand and remember information. Many people understand a picture more quickly than blocks of text. A best Online Graphs & Charts Maker can help you make your point more convincingly and lend credibility to your presentation.Charts display data in a graphical format that can help you and your audience visualize relationships between data. When you create a chart, you can select from many chart types
Top 10 Software
What is the Best Online Graphs & Charts Maker?
1. Lucid Chart
Lucidchart One of the Best Online Graphs & Charts Maker, it is a web-based diagramming application that allows users to visually collaborate on drawing, revising and sharing charts and diagrams, and improve processes, systems, and organizational structures.
2. Edrawsoft : Online Graphs & Charts Maker
Edraw Max is a 2D business technical diagramming software which helps create flowcharts, organizational charts, mind map, network diagrams, floor plans, workflow diagrams, business charts, and engineering diagrams .With EdrawMax, you no longer rely on Microsoft Visio to open Visio files. This free diagram software lets you easily import and export Visio files and, at the same time, helps you in making over 280 different types of diagrams.
3. Visio in Microsoft
Visio lets you transform complicated text and tables that are hard to understand into visual diagrams that communicate information at a glance. There are many kinds of Visio diagrams, including organization charts, network diagrams, workflows, and home or office plans.
Visio in Microsoft 365 is available to Microsoft 365 commercial subscribers, so you can create professional diagrams anytime, anywhere, with anyone.
4. Visme
Visme Number 04 in our Best Online Graphs & Charts Maker List is an online tool for creating, editing, sharing, and storing visual materials. You can use it as a presentation app to make slide decks, but you can also create templates for infographics, charts, logos, storyboards, graphics for social media posts and the web, letterheads, and other items.Visme is everything you need to create beautiful content. It’s one tool to design, store and share your content. One tool that gives you all the templates, graphics, assets you need. And the place to get free educational content built to give non-designers the resources to become amazing visual communicators.
5. LiveGap Chart
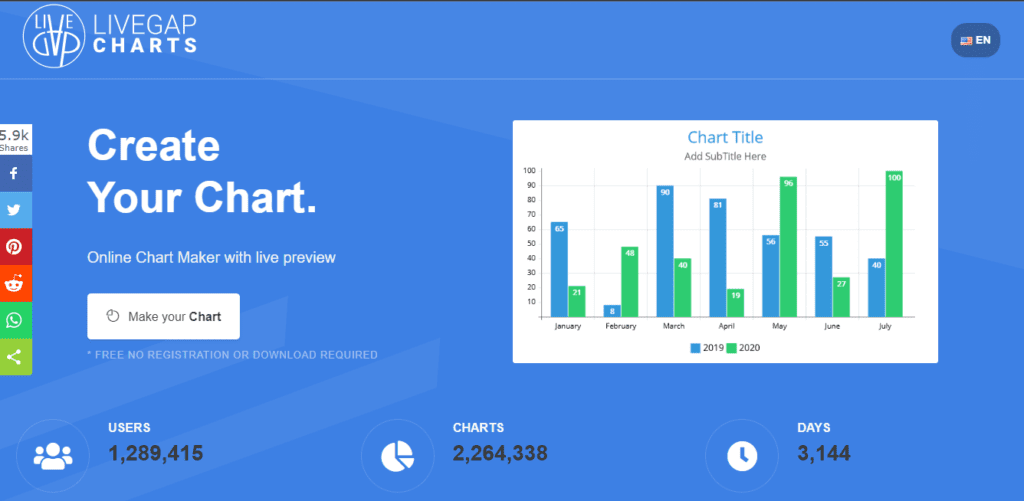
LiveGap Charts is a free website where teachers can create and share all kinds of charts: line, bar, area, pie, radar, icon matrix, and more. Start with a template and then edit the data in the spreadsheet (or copy it from your own spreadsheet). From there, there are tons of customization options.
6. Creately

Creately offers multiple features to simplify the online drawing and collaboration experience. It’s a cloud-based application, therefore all your files can be accessed from anywhere, from any device. Real-time collaboration for online brainstorming, meetings, workshops, planning, etc.
7. Moqups

Moqups is a visual collaboration program with many tools like whiteboards, design features, and diagrams. It is one of the best ways for companies to plan, collaborate, communicate and enhance people and work management . Moqups allows you to create a variety of visual products to support all sorts of projects. It includes dashboards, mind maps, prototypes, mockups, wireframes, and many more ways to amplify an organization’s message.
8. Vizzlo
Vizzlo is described as ‘browser-based tool to create professionally designed charts, graphics, and business visualizations in just a few seconds. Preparing high-quality visual aids for presentations can be time intensive, and results are usually not satisfactory’ and is an app in the office & productivity category. There are more than 10 alternatives to Vizzlo for a variety of platforms, including Online / Web-based, SaaS, Windows, Self-Hosted solutions and Mac.
9. Gliffy
Gliffy is software for diagramming via an HTML5 cloud-based app. It is used to create UML diagrams, floor plans, Venn diagrams, flowcharts and various other kinds of diagrams online. Gliffy diagrams can be shared with and edited by users in real time. The SaaS is supported in all modern web-browsers, including Google Chrome, Firefox, Safari and Internet Explorer 9+.
10. Infogram
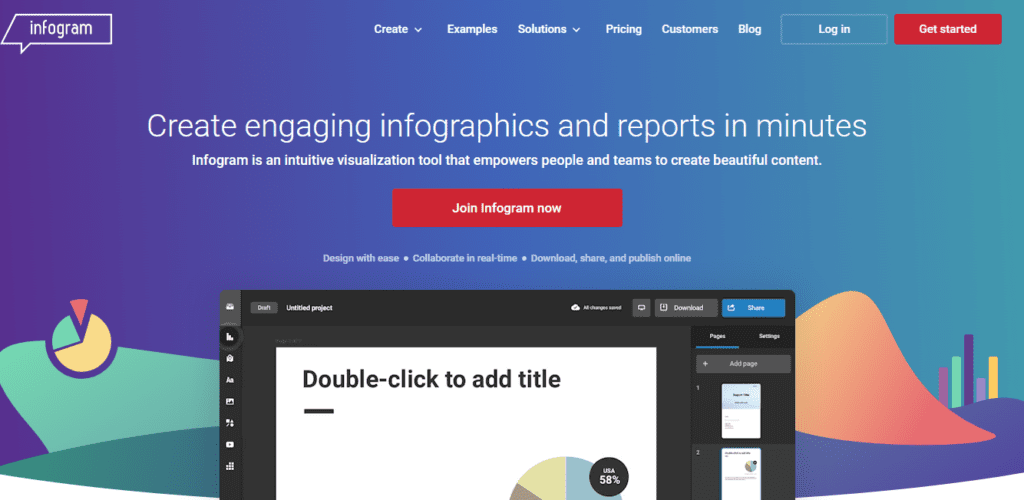
Infogram is an intuitive visualization tool that empowers people and teams to create beautiful content. It is easy and quick to use and the results look great. Infogram is not heavyweight data visualization software, it’s best for summarizing and explaining the results of data analysis to an audience or breaking down complex concepts to make them understandable to the general public.
Conclusion
as mentioned in today’s article that there are several tools to creat charts and The best tools offer a variety of visualization styles, are easy to use, and can handle large data sets. we hope that those tools will be helpful for you and for the tasks that you are aiming to accomplish .


